What are Automated Strategic Displays?
(Watch the 5 minute video on the right)
Where can you stand to get a good view of the supply chain? Unfortunately, nowhere. Supply chains have too many suppliers, plants, warehouses, too many products, customers, and materials to be able to ever “see it.” Yet, supply chain managers need an efficient and effective way to show senior management key performance metrics and the cross-network impacts of events.
This project seeks to tap into companies’ operating system data bases to automatically create strategic display such as:
- Working Capital Deployment across the network
- Capacity Constraints (bottlenecks) in the network
- Risk Pathways (most vulnerable segments) across the network
- Cost Accumulation across the network
- Cycle Time Accumulation across the network, and
- Market Share Impacts of major events
The initial project will focus on the supply chain risk metrics and will be creating two kinds of Automated Strategic Displays:
The first is a high-level left to right material flow diagram of nodes and links highlighting the company’s most vulnerable pathway.

Another way to display the strategic metric is on a geographic map:
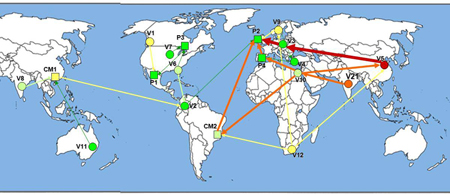
It should be possible to toggle back and forth between the network diagram and the map-based display.
Four Research Questions
1. How can manufacturing and distribution companies use the detailed data captured in their operating systems to better understand the high-level strategic (end to end) flows of materials and money across their supply chain?
2. Can we use this data (above) to create a strategic high-level visual display of the supply chain suitable for discussions at the board level?
3. What high-level supply chain metrics make the most sense and how can we calculate them in a network setting? For risk: can we use these metrics to find the weakest (most vulnerable) nodes and links in the network?
4. Can we use the high-level visual display methods (above) to better communicate information about the weakest links and the cross-network impacts of risk events to senior management?
Approach
The project will leverage the large amount of information captured in the companies’ operating systems, such as the ERP system to create automated displays.

How can I participate?
The research project is now getting started and both MIT and the participating companies welcome other companies to join the effort. Sponsoring companies will share the funding and provide staffing for piloting the tool in their company.
The project will run for 3 years creating a more robust set of methods and tools each year. We will create a working set of methods and tools which will be transferred to the all participating companies at the end of each year.
How do I join?
By joining the ASD project companies will split the development cost of this capability. The tools developed will benefit from the best ideas from each participant. Member companies will also benefit greatly by sharing ideas and risk management techniques with each other. The MIT team will visit your company to help launch your pilot test.
Learn more about joining the ASD project by contacting:
Dr. Bruce Arntzen
barntzen@mit.edu
617-252-6965