CAMBRIDGE, MA – The MIT Center for Transportation and Logistics (CTL) has launched an interactive mapping tool that quantifies exposure to artificial intelligence across U.S. regions, industries, and job types. The new AI Labor Exposure Map, developed by PhD student Pierre Bouquet and visiting student Luca Mouchel, shows that under a full-adoption, substitutive-use scenario based on current AI capabilities, AI could currently perform work equivalent to approximately $1.4 trillion per year in U.S. wage-bill equivalent.
The tool is available at https://www.workanalyticslab.com/us-ai-map/.
Data and Methodology
The analysis integrates three key data sources: employment and wage data sourced from the Bureau of Labor Statistics May 2024 Occupational Employment and Wage Statistics (OEWS) at state and metropolitan statistical area levels; job-to-task mapping constructed using the MIT Work Analytics Lab methodology from “Estimating the Task Content of Work” (Bouquet et al., 2026); and AI capability assessments derived from both the Anthropic AI Economic Index for current capability and the GPTs are GPTs framework (Eloundou et al., 2023) for theoretical capability.
Under the current Anthropic-based scenario, the model estimates that if current reported AI task capabilities were fully adopted across the economy and substituted at the levels reported by Anthropic, Claude could perform work equivalent to approximately 18 million FTE workers, corresponding to about $1.4 trillion per year in wage-bill equivalent. Under the broader theoretical OpenAI-based scenario, which considers tasks that AI could accelerate by 50% or more, the estimate rises to approximately 36 million FTE workers, corresponding to about $2.9 trillion per year in wage-bill equivalent.
These figures are not predictions of layoffs, impacted workers, or unemployment. They are scenario-based estimates of labor input that would be exposed under full-adoption and substitutive-use assumptions.
Key Findings
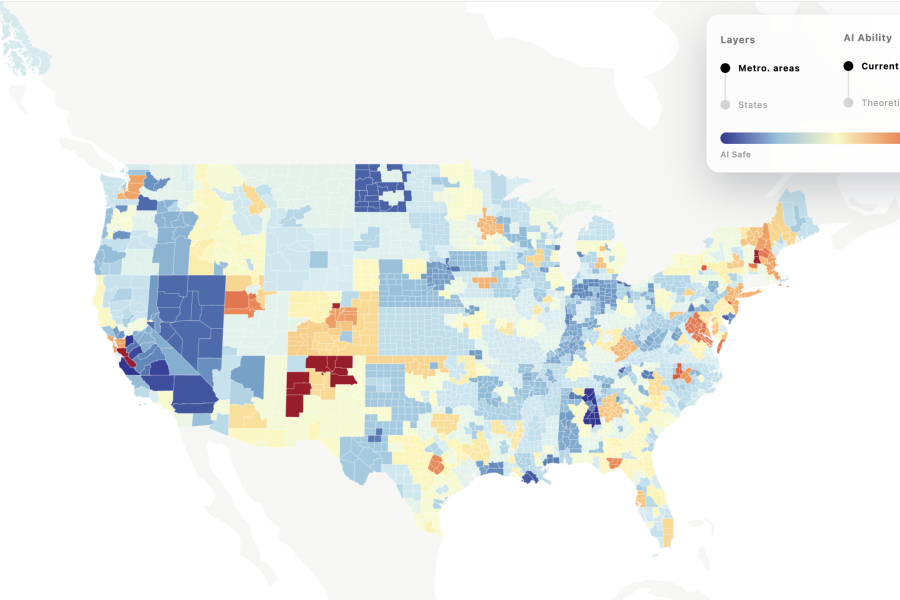
“This research cuts through the hype around AI by providing concrete data about where economic exposure actually exists,” said Bouquet. “The key point is that exposure is not evenly distributed geographically nor across the workforce. "While overall workforce exposure appears at 13%, these jobs represent 16% of the total wage bill, meaning high-paying white-collar positions are most exposed to AI impact."
The interactive platform reveals stark regional disparities. Washington, D.C., for example, faces twice the workforce exposure of Wyoming, at 20% versus 10%. Even within the same region, variations are significant: Boston's metropolitan area shows substantially higher AI exposure than Bangor, Maine, reflecting starkly different workforce compositions.
The tool distinguishes between current AI capabilities, measured through adoption patterns of Anthropic’s Claude AI system, and theoretical capabilities based on OpenAI capability-frontier research. This dual-measurement approach provides both a current-use-based assessment and a broader scenario-based projection.
“‘Exposure’ does not necessarily mean job elimination,” Bouquet clarified. “It means that some tasks within jobs can be accelerated or automated, potentially augmenting rather than replacing workers. A financial manager, for example, might see loan application evaluation become highly automatable, while training, oversight, and judgment-intensive responsibilities remain human-dependent.”
Granular Insights Across Sectors
The map allows users to narrow down by state, metropolitan area, industry, and specific job tasks. Notably, service industry positions such as food preparation and serving remain largely AI-resilient. On the other hand, computer and mathematical fields show among the highest exposure, with programmers particularly exposed to current and theoretical AI capabilities. Some local areas may also show unexpected exposure patterns due to their specific workforce composition.
Applications for Policymakers, Business, and Media
Policymakers can use the tool to identify communities facing the greatest AI-related impact and plan workforce transitions accordingly. Companies can evaluate the implications of facility placement and workforce strategy. Local news outlets can report on region-specific exposure patterns, while national media can contextualize AI's economic scale, using localized, task-level labor-market data.
“Someone in Wyoming sees very different exposure than someone in D.C., and that is now visible and actionable,” said Bouquet. “Regions with higher AI exposure may face greater labor-market pressure if displaced workers compete in a smaller pool of available roles. That could affect job competitiveness, entry-level opportunities, and wage dynamics. While the map does not forecast those outcomes, it helps identify where such pressures could emerge.
About the MIT Center for Transportation and Logistics
The MIT Center for Transportation & Logistics (MIT CTL) is a world leader in supply chain management research and education, with over 50 years of expertise. The center’s work spans industry partnerships, cutting-edge research, and driving supply chain innovation into practice through three pillars: research, outreach, and education. ctl.mit.edu
Media Contact:
Mackenzie Berry
berrym@mit.edu
617-258-6083